
Renamed in 2015, the Google Search Console was initially known as Google Webmaster Tools. Every year, new tools are added. The new version of the Search Console is now officially launched. So, it was time for me to offer you my complete guide to the Search Console. You can use the Google Search Console for just about anything. But do you know its full potential?
The Search Console is sometimes underused. I present here a very detailed guide that covers everything you need to know about the Google Search Console and explains how to use it properly.
🚀 Quick read: what you will learn about the Google Search Console
In this tutorial, which is perfectly accessible to beginners, you will discover everything you need to know to use the Google Search Console (GSC) optimally.
- URL Inspection
- Performance of your website
- Discover report
- Indexing
- Coverage of your web pages
- Loading speed of your site
- Mobile usability
- Link building
Related articles: how to install the GSC and 7 steps to use the Google Search Console effectively.
❓ What is the search console?
The Google Search Console is a service offered to all website administrators. This tool helps to improve the organic ranking of the site in question.
More concretely, the features of the Google Search Console allow you to check the frequency at which Google's robots index your site. You also have the possibility to follow daily the keywords and queries that generated a visit to your site from the search engine. It is therefore a powerful and essential measurement tool offering you numerous resources to optimize your ranking as much as possible.
Since the last update, the tool has been improved and redesigned for its users, particularly in terms of its ergonomics to make it more readable for everyone. You will find the "URL inspection" and "coverage" tabs to detect errors on your website (indexing, site maps, etc.) as early as possible.
A place has also been made for smartphones, as we know today a large part of Internet users consult from their mobile. Be careful with the non-responsive version and/or too heavy for reading from a mobile! Another change also accessible from your Google account: you now have visibility over 16 months, compared to 3 months before.
🛠️ Search Console analysis tools
URL Inspection Tool
The URL Inspection Tool is important because it allows you to know directly if your page is indexed by Google or not and to gather information on how your domain name is indexed. It is very similar to the "Fetch as Google" tool that was available in the old version of the GSC. When you enter the full URL to inspect, you get information about the indexed version of your page. If you click on "View crawled page," you get a screenshot of the page as it appears for Googlebot.
To use the new URL Inspection Tool, start a session by inserting your URL into the top search bar of the Google Search Console. You should then get a report like this:
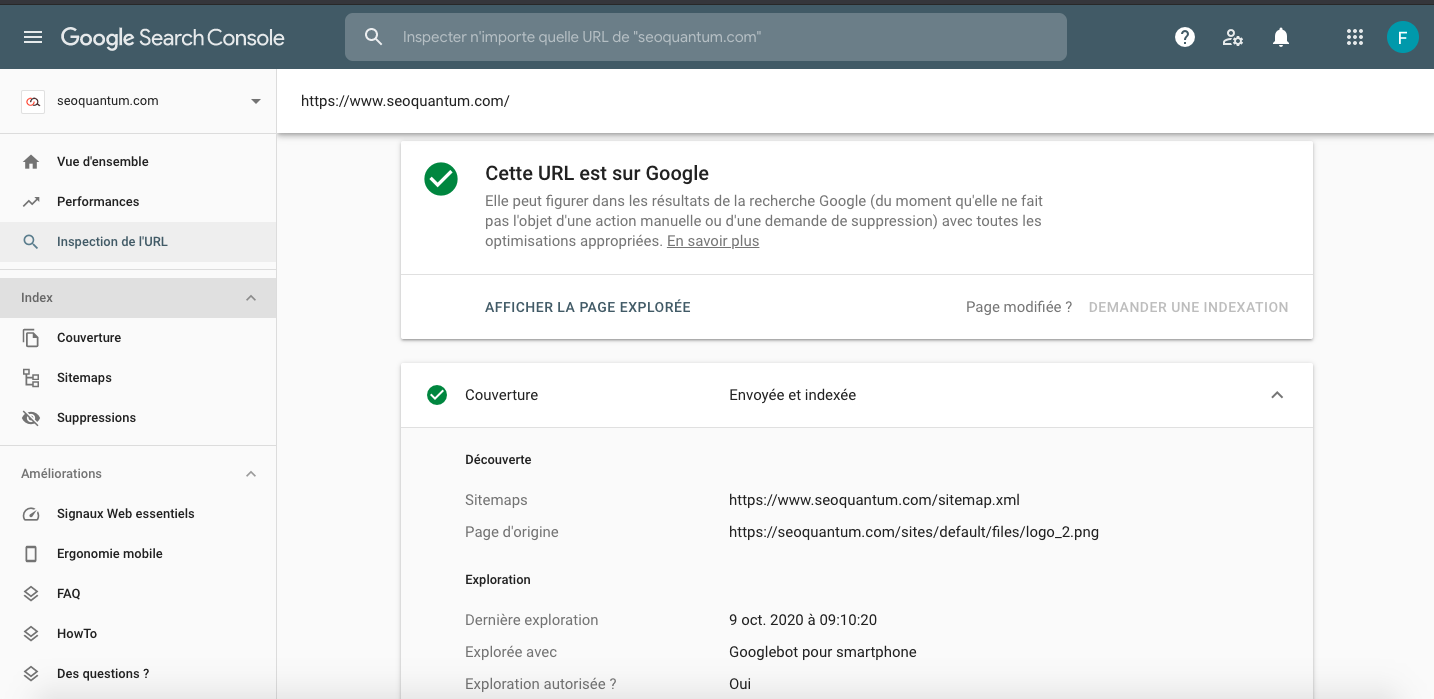
This report can also help you to:
- Update an old web page
- Create a new section on your website
- Redesign your site for mobile navigation
- Check the robots.txt file
- Monitor your tags
- Manage the transition from HTTP to HTTPS
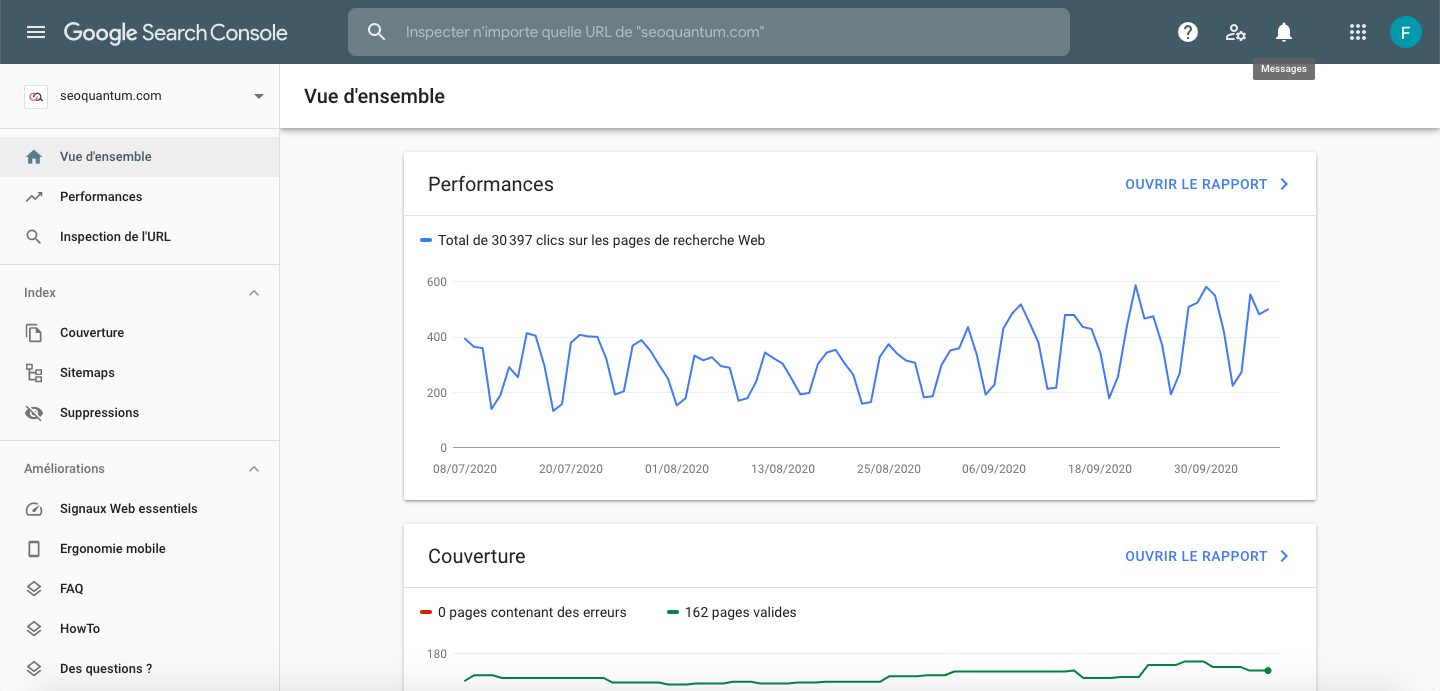
Search Console Performance Report
This report is the essence of the Search Console. In its old version, it displayed a summary of your website's crawl frequency over 7, 28, or 90 days.
The data appearing on the dashboard corresponds to the following parameters:
- Queries
- Pages
- Countries
- Devices
- Search type
- Number of clicks
- Date
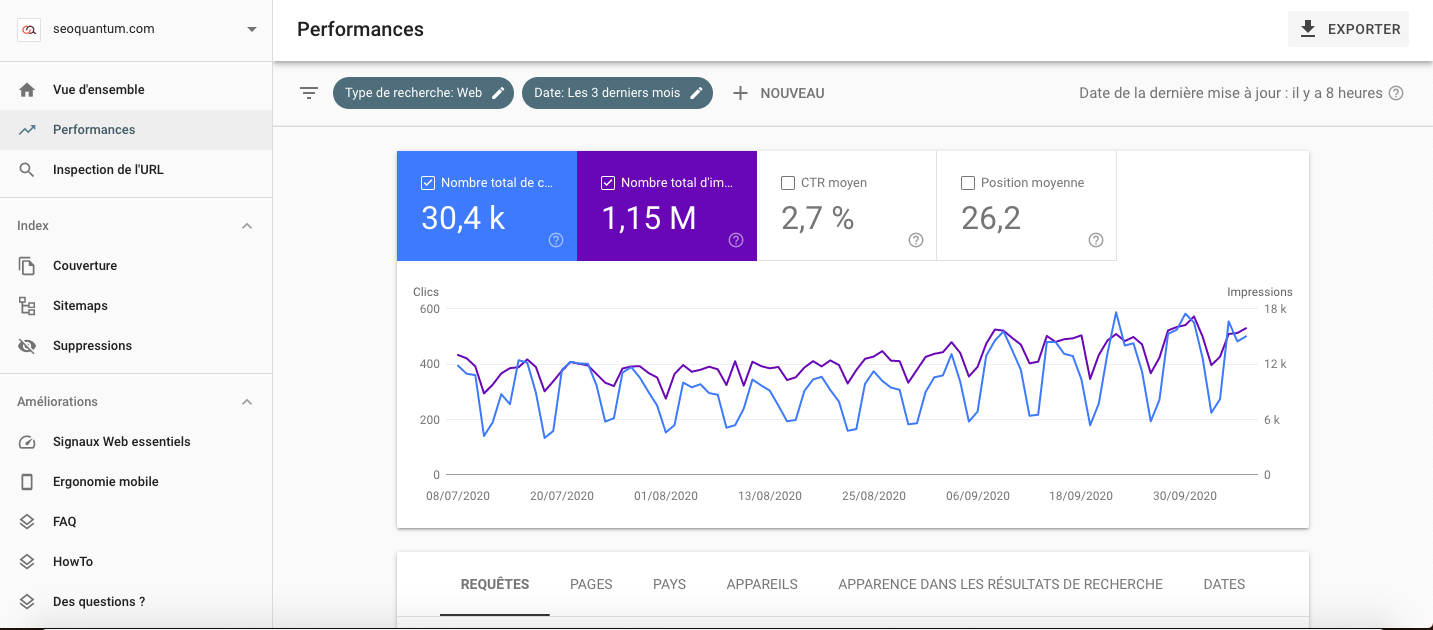
In the new version of the GSC, this data is available under the "Performance" section, but you still have the same metrics, which are now available over 16 months. Additionally, you can filter the results by:
- Job offers
- Rich results
- AMP pages
- Non-rich AMP results
In addition to the information useful for content strategies, there are data on impressions and clicks by country and according to the type of device. If you want the data to be generated in the form of spreadsheets, download the Google Chrome extension. This allows you to save time and be more efficient.
You can use this data to identify:
- The most performing pages
- Pages with a low click-through rate
- Click-through rate by keyword
- Number of impressions per keyword
I use this data to determine which metadata to rewrite. When a page has a high number of impressions and a low click-through rate, it is often due to the meta title or meta description.
Discover Report
The Discover report was added to the Google Search Console during the 2019 update. This report aims to provide a better overview of how users discover your site.
If you publish articles, you can use this report to understand how users interact with your website on their Google Discover news feed.
You can see which types of content are performing well, compare the performance of your content on Discover and Google Search, and know the number of users who visit your website via Discover.
Index
Are you looking for data related to index bloat, trying to find out if CSS files are blocked, or want to remove a URL? Then the index coverage reports will be very useful to you. Unfortunately, they are difficult to understand.
I have faced a multitude of SEO challenges, from low organic traffic to Panda penalties due to short content. Index coverage reports provide data on the performance of your content in Google Search. However, if you are looking for the Content Keywords option, don't look any further: it was removed in November 2016.
Coverage Report
In the old version of GSC, the "Index Status" option allowed you to know the URLs of your website indexed by Google during the previous year. In the new GSC, the index coverage report also displays all your indexed web pages and a list of pages not included in your sitemap. This report should be checked regularly to ensure that there is no significant increase or decrease in the number of indexed web pages.
For my part, I use this report to determine if there are index bloat issues. For this, the number of pages in the index coverage report should be the same as the number of landing pages receiving organic traffic in Google Analytics. If they do not match, it most likely means that only a small portion of your indexed web pages are receiving traffic.
How to find index bloat data in the Search Console?
Follow these steps:
- Navigate to the new Google Search Console > Index> Coverage. You should get something like this:
- Go to Google and perform a site search: [insert your website URL]
- Check which pages appear among the results.
- If you notice the presence of pages that you did not want to see indexed, add the noindex tag to each of them and modify your site's robots.txt file.
Rather than trying to improve web page speed and keyword mapping, prioritize resolving crawl errors first.
Some common crawl errors:
- DNS error (Domain Name System): This error means that there is a problem with the server, so it is important to contact your web host (GoDaddy, BlueHost, etc.).
- Server errors: Server errors usually occur when your website receives too much traffic. You need to investigate further to see if it is a connection or timeout issue.
- Soft 404 errors: A soft 404 error occurs when the server displays a real page for a URL that actually does not exist on your site. To fix this problem, set up a 301 redirect if the web page is dead or check that the page does not contain too much content or duplicate content.
- 404 errors: These are the most common errors. 404 errors can occur when you unpublish a web page, delete a page, etc. Although 404 errors do not necessarily impact your ranking, they can affect your backlinks. If more than 20 backlinks point to a 404 page, you should create a 301 redirect immediately.
- A 301 redirect can turn a dead link into a high-performing backlink. In other words, if one of your pages that usually generates many links is broken, the 301 redirect will allow you to continue to gain authority for these backlinks.
Speed Report
The Speed Report has been available since November 2019. It allows marketers to identify all page speed issues directly through the Search Console.
This report allows you to track changes over time. If you update a URL, this report will help you ensure that the page speed has improved. It will also help you identify well-optimized URLs.
Mobile Usability and AMP
Even if your content marketing strategy is well thought out, the navigation on your website can quickly deteriorate, resulting in fewer leads and an increased bounce rate if the mobile version is not good.
This report provides an assessment of mobile usability for all indexed pages on your site. Side effects of a poorly designed mobile website include loss of organic traffic and customers.
Here are some common errors addressed by the mobile usability report and their solutions:
- Content is wider than the screen: Make sure your web pages do not require horizontal scrolling to be fully viewed.
- Clickable elements too close together: Check that your links and buttons are far enough apart.
- Viewport tag not configured: Check your web pages to see if they use the meta Viewport tag so that the size of your web pages adjusts to different mobile devices.
What is the AMP (Accelerated Mobile Pages) report?
Whenever I have the opportunity to increase page speed slightly, I take advantage of it. Accelerated Mobile Pages (AMP) have all the SEO benefits I like and are easy to implement. Want to increase web page loading speed? Boost mobile SEO? Improve server performance? Then this report is for you!
The Search Console's AMP report tracks pages in AMP format. You can identify layout issues for AMP pages as well as template issues. You can also use the GSC's AMP testing tool. You will also find information on rich pages and information on AMP in the performance report. This is quite handy!
Link Report
In a perfect world, all sites would have many high-quality external links. And in a truly perfect world, great websites would link to our websites. But that's simply not the case.
The link report shows you websites that link to your website. We must be careful about the origin of our backlinks. And with the ongoing changes in Google's algorithm, knowing when to disavow backlinks can be tricky.
To monitor backlinks in the Search Console, follow these steps:
- Go to the "Links" section
- Click on "Top linking sites"
- Click on the arrow to export the report
- Identify potential anomalies. This will help you discover potential issues related to spam links.
In a previous article (free tools from Google), we already talked about Google Search Console, a powerful and essential tool for optimizing the organic ranking of your website.
Integrate the Search Console into SEOQuantum to track the performance of your content optimizations with ease. We invite you to discover all this with our presentation video: https://www.youtube.com/watch?v=AyJrZ_ZvGzU.
🙏 Sources used to write this article
Need to go further?
If you need to delve deeper into the topic, the editorial team recommends the following 5 contents:
